




The USD/CAD currency pair is ending the trading week with gains, forming a “Double Bottom” reversal pattern. Moving averages indicate a bullish trend. Prices are re-testing the area between the signal lines, signaling growing buying pressure and the potential for continued growth in the near term. Currently, we should expect an attempt at a decline and a test of the support level near 1.3825, followed by an upward rebound and a rise in quotes toward a target above 1.4425.
USDCAD Weekly Forecast September 14 – 18, 2026
An additional signal favoring a rise in the USD/CAD pair is a test of the support line on the Relative Strength Index (RSI). A second signal would be a rebound from the lower boundary of the bullish channel. The bullish scenario for the week of September 14–18, 2026, would be invalidated by a drop and a breakout below the 1.3685 area; this would indicate a support breakdown and a continued decline below the 1.3515 level. Confirmation of the pair’s growth would come from a breakout of the resistance level and a close above 1.3955, signaling a break of the “Double Bottom” pattern’s upper boundary and the start of the pattern’s upward targets.
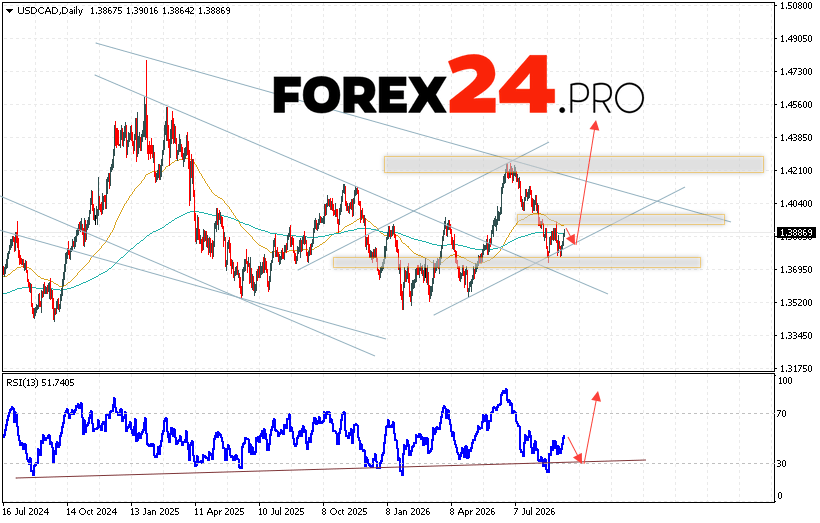
USDCAD Weekly Forecast September 14 – 18, 2026, anticipates an attempt at a correction and a test of the support area near 1.3825, followed by continued growth toward a target above 1.4425. An additional signal supporting this rise is a test of the support line on the RSI indicator. A drop and a breakout below the 1.3685 area would invalidate the bullish scenario. This would signal a break of a key support level and a continued decline targeting levels below 1.3515.
