




The USD/CHF currency pair is ending the trading week with gains within a descending channel, trading near the 0.8302 level. Moving averages indicate a bearish trend. Prices have broken upward through the area between the signal lines, signaling rising buying pressure on the US currency and the potential for the instrument to continue rising from current levels. At this stage, we should expect an attempt at price growth and a test of the resistance area near 0.8365. This would be followed by a downward rebound and an attempt to resume the pair’s decline, targeting levels below 0.7875.
USDCHF Weekly Forecast October 12 – 16, 2026
An additional signal favoring a decline in the USD/CHF pair would be a test of the resistance line on the Relative Strength Index (RSI). A second signal would be a rebound from the upper boundary of the “Wedge” reversal pattern. The bearish scenario for USD/CHF this week would be invalidated by a strong rise in quotes and a breakout above the 0.8545 area. This would indicate a breakout of the resistance zone and a continued rise for the pair, targeting levels above 0.8925. Confirmation of the pair’s decline during the week of October 12–16, 2026, would come from a breakout of the support area and a close below the 0.8045 level; this would signal a breakout below the lower boundary of the “Wedge” reversal pattern and the start of the pattern’s downward targets.
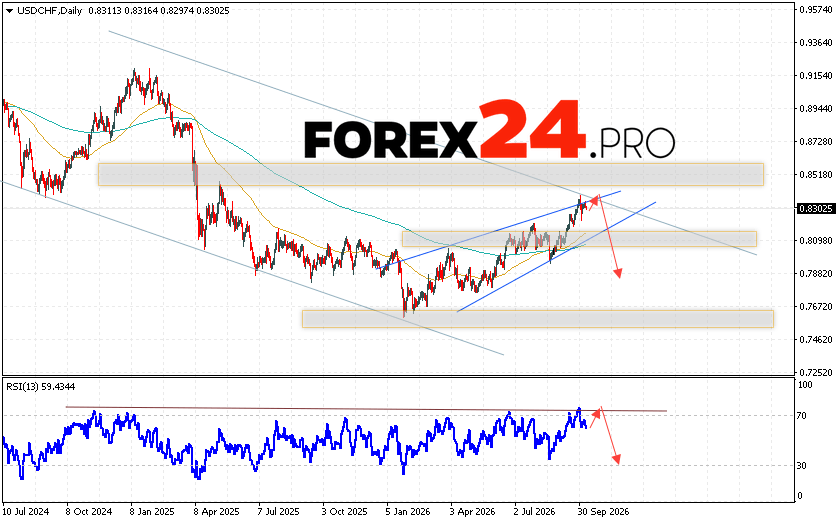
USDCHF Weekly Forecast October 12 – 16, 2026 anticipates an attempt at a bullish correction and a test of the resistance level near the 0.8365 area. Next, the USD/CHF pair is expected to continue falling toward the area below the 0.7875 level. A test of the trend line on the Relative Strength Index (RSI) indicator supports this bearish outlook. The scenario calling for a USD/CHF decline would be invalidated by a breakout above the resistance zone and a close above the 0.8545 level; this would signal a continued rise for the pair, with a potential target above 0.8925.
