

Quotes Oil WTI traded at the level of 51.33 dollars per barrel. Oil is trading below the moving average with a period of 55, indicating a bearish trend for WTI Oil. At the moment, quotes of the pair test the lower boundary of the bands of the Bollinger Bands indicator. The test of the average border of the Bollinger Bands indicator bars near the level of 52.20 is expected, where again we should expect an attempt to continue the fall and further development of the downward trend in Oil with the first target near the level of 49.50.
Bollinger Bands forecast WTI on April 21, 2017
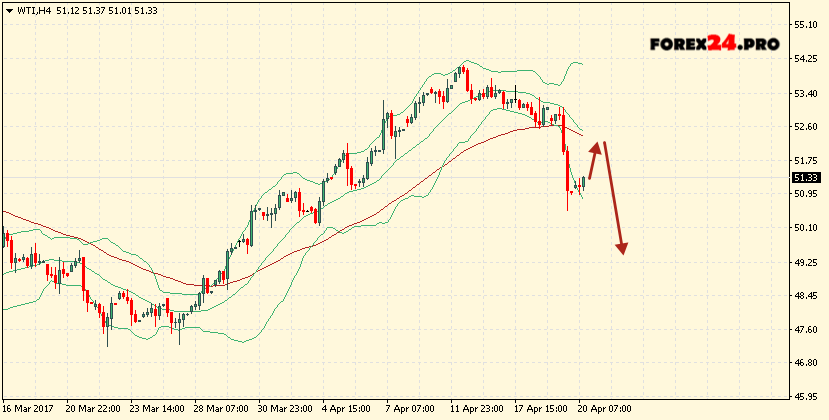
The conservative sales area is located near the upper border of the Bollinger Bands indicator strip at 54.10. Canceling the option to continue falling WTI Oil will be a breakdown of the moving average region with a period of 55, as well as the upper boundary of the indicator bars and the closing of oil quotes above the area of 55.00, indicating a change in the trend in favor of the bull on WTI. In the event of a breakdown of the lower boundary of the indicator bands, it is expected to accelerate the fall of Oil to a region below the level of 49.50.