



XAG/USD prices continue to move within the bullish correction and the formation of a triangle pattern. At the time of publication of the silver forecast, the price is 58.18. Moving averages indicate a bearish trend. Prices are testing the area between the signal lines, indicating bearish pressure and a potential continuation of the decline from current levels. Currently, an attempt to develop a rise in the metal price and a test of the resistance area near 59.55 is expected. Where should we expect a price rebound and a continued decline in Silver with a target below 51.65?
Silver Forecast XAG/USD for July 31, 2026
An additional signal favoring a decline in Silver XAG/USD quotes and prices will be a test of the descending resistance line on the relative strength indicator (RSI). A second signal favoring a decline will be a rebound from the resistance level on the price chart. A strong rally and a breakout of 62.55 would invalidate the Silver price decline on July 31, 2026. This would indicate a breakout of the resistance area and continued growth above 68.65. Expect the XAG/USD price decline to accelerate with a breakout of the support area and a consolidation below 55.65, which would indicate a breakout of the lower boundary of the Triangle pattern and the beginning of the pattern with targets below.
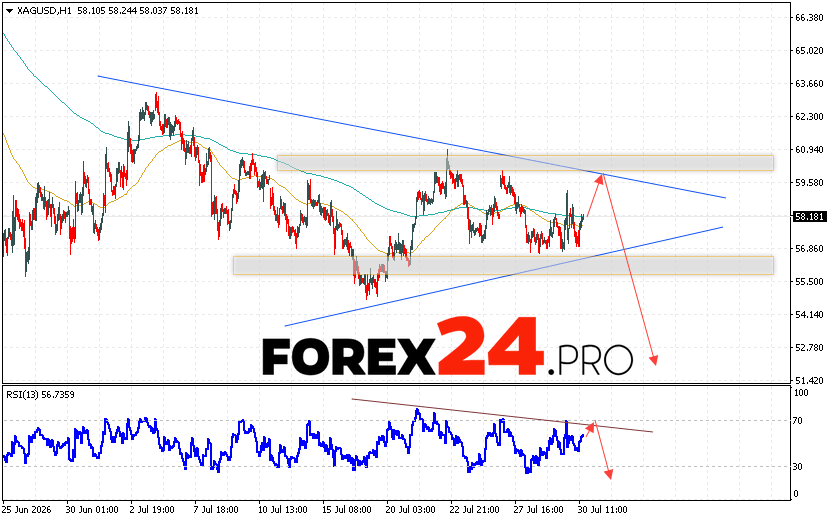
Silver Forecast XAG/USD for July 31, 2026 suggests an attempt to test the resistance area near 59.55. A downward rebound and continued decline in silver are expected, with a target below 51.65. A strong rally and a breakout of 62.55 would cancel out the downward trend. This would indicate a breakout of the resistance area. In this case, a continued rise in silver is expected, with a target of 68.65.
