



The BTC/USD pair is trading at 63,172, continuing its downward movement and beginning to form a “Triangle” pattern. Moving averages indicate a short-term bearish trend for Bitcoin. The price has broken through the area between the signal lines, signaling pressure from the “digital gold” bears and suggesting a potential further decline in the asset’s value from current levels. For tomorrow, November 19, 2026, we anticipate an attempt at a rebound, with a test of the resistance level near 64,205. From there, we expect another downward bounce, with the price likely continuing its decline toward a target below 56,205.
Bitcoin Forecast and BTC/USD Analysis for November 19, 2026
An additional signal supporting a decline in BTC/USD is a test of the resistance line on the Relative Strength Index (RSI). A second supporting factor would be a rebound from the lower boundary of the “Triangle” pattern. The bearish scenario would be invalidated if the asset’s price rises sharply and breaks through the 67,505 level; this would signal a breakout above the resistance zone and a potential continuation of the uptrend, with a target of 75,405. A confirmation of the decline would be a break below the support zone, with the price consolidating beneath the 60,305 mark.
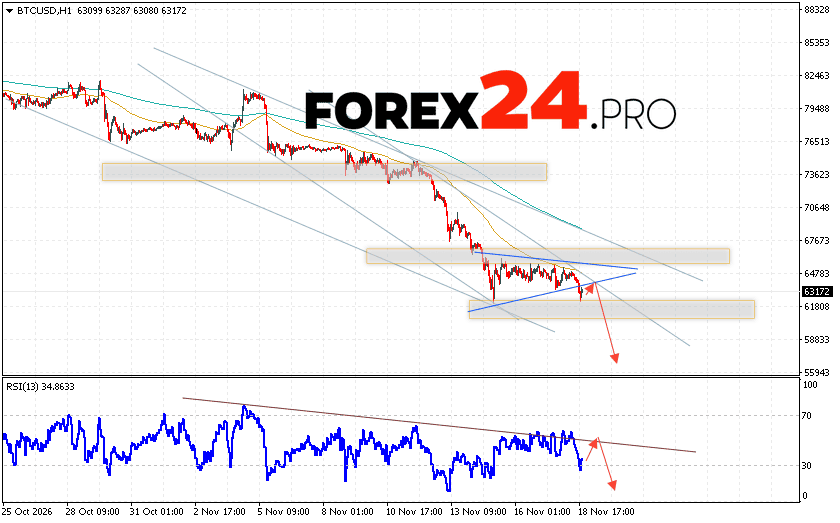
Bitcoin Forecast and BTCUSD Analysis for November 19, 2026 suggests an attempt to test the resistance level near 64,205, followed by a continued decline in the cryptocurrency toward a target of 56,205. A test of the resistance line on the Relative Strength Index (RSI) serves as an additional signal pointing toward a drop in the price of Bitcoin. A breakout above the 67,505 area would invalidate the bearish scenario for the digital currency, signaling a continuation of its upward movement with a potential target above the 75,405 level.
