




BTC/USD is trading at 63,797, continuing its downward movement and beginning to form a “Triangle” pattern. Moving averages indicate a short-term bearish trend for Bitcoin. Prices have broken through the area between the signal lines, signaling pressure from the “digital gold” bears and a potential continuation of the asset’s decline from current levels. For tomorrow, November 20, 2026, we can expect an attempt at a rebound, testing the resistance level near 64,905. From there, a downward bounce is likely, with the price potentially continuing its decline toward a target below 56,565.
Bitcoin Forecast and BTC/USD Analysis for November 20, 2026
An additional signal supporting a decline in BTC/USD is a test of the resistance line on the Relative Strength Index (RSI). A second supporting factor would be a bounce off the lower boundary of the “Triangle” pattern. The bearish scenario would be invalidated if the asset’s price rises sharply and breaks through the 67,775 level; this would signal a breakout above the resistance zone and a continued rally, with a potential target of 75,455. A confirmed decline would be signaled by a breakdown of the support zone, with the price stabilizing below the 61,775 mark.
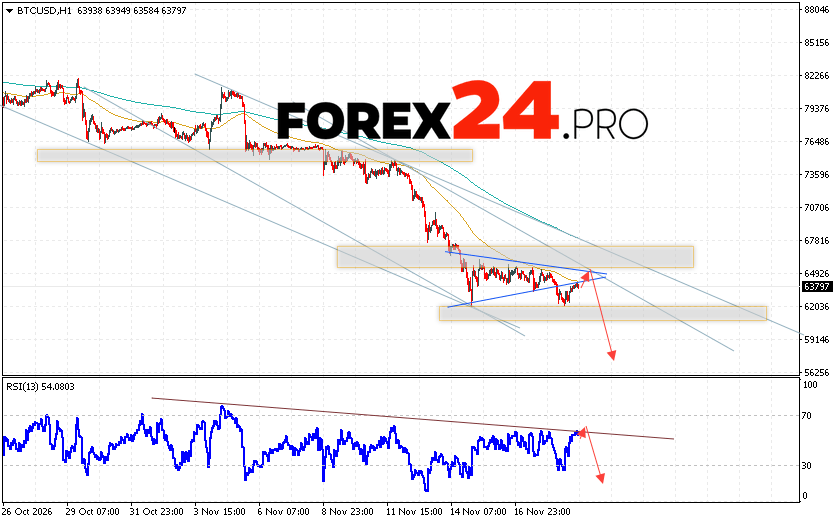
Bitcoin Forecast and BTC/USD Analysis for November 20, 2026 anticipates a test of the resistance level near 64,905, followed by a continued decline in the cryptocurrency toward a potential target of 56,565. A test of the resistance line on the Relative Strength Index (RSI) serves as an additional indicator pointing toward a drop in the Bitcoin price. A breakout above the 67,775 level would invalidate the bearish scenario for the digital currency, signaling a continuation of its upward movement with a potential target above 75,455.
