




ETH/USD quotes are trading at 1869 and continue to move within the correction, having broken out of the bullish channel. Moving averages indicate a short-term bullish trend for Ethereum. Prices are again testing the area between the signal lines, indicating buying pressure and potential continued growth in the asset’s price from current levels. Today’s Ethereum forecast anticipates an attempt to develop a price correction and a test of resistance near 1905. From there, we should expect another downward rebound and a continued decline in the Ethereum price, with a potential target below 1565.
Ethereum Forecast and ETH/USD Analysis for 6 August 2026
An additional signal for a decline in ETH/USD quotes will be a test of the downward trend line on the relative strength indicator. A second signal will be a rebound from the lower boundary of the bullish channel. A decline in the cryptocurrency will be canceled if Ethereum’s price falls and breaks below 1805. This will indicate a breakout of the lower boundary of the bullish channel and a continued decline in ETH/USD quotes toward 1565. A breakout of the support area and a consolidation below 1805 will confirm the asset’s price decline, signaling a breakout of the lower boundary of the bullish channel.
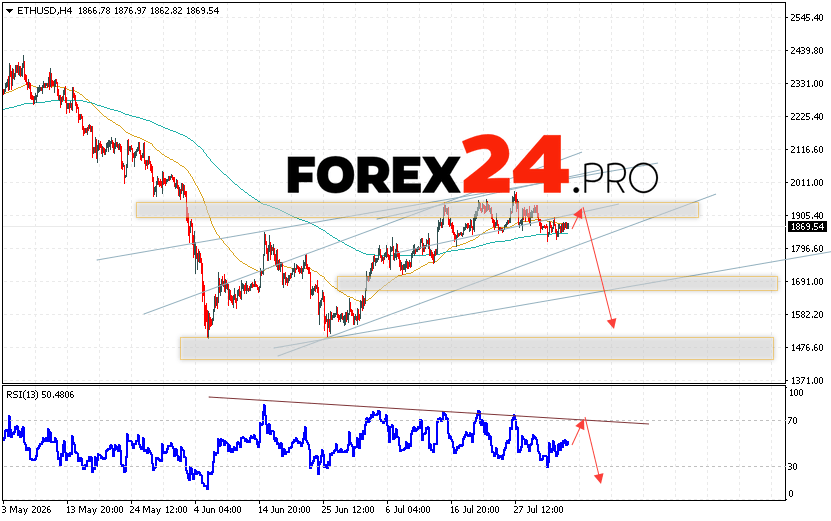
Ethereum Forecast and ETH/USD Analysis for 6 August 2026 suggests an attempt at a bearish correction and a test of the resistance area near 1875. From there, a rebound and continued decline in the ETH/USD cryptocurrency to below 2060 should be expected. A test of the trendline on the relative strength indicator (RSI) would be an additional signal of a decline in the Ethereum price. A break of the resistance area at 1965 would invalidate this downward trend, indicating continued growth with a potential target above 2245.
